
Gas ChromatographyGC
In the world of scientific research and experimentation, raw data alone is not enough. To drive meaningful discoveries and informed decision-making, data must be presented in a clear, insightful, and familiar format. Scientific data visualization plays a crucial role in bridging the gap between raw information and actionable knowledge, allowing researchers, analysts, and decision-makers to extract valuable insights from complex datasets.
Scientific analysis generates vast amounts of data from multiple sources, including laboratory instruments, simulations, real-time monitoring systems, and historical archives. Without effective visualization, this data remains difficult to interpret, leading to delays, misinterpretations, or missed opportunities. By transforming raw numbers, measurements, and structures into visually meaningful representations, scientists can:
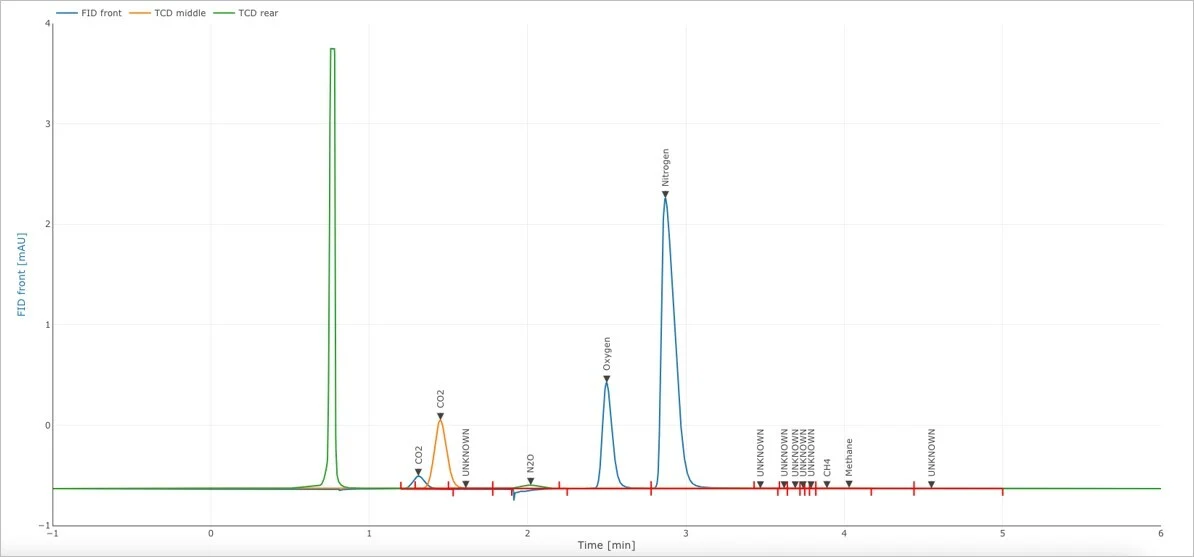
View all instrument data in Splashlake without the original instrument software. Put two runs side by side, lay them over one another or drill into a single peak, all with full context intact.
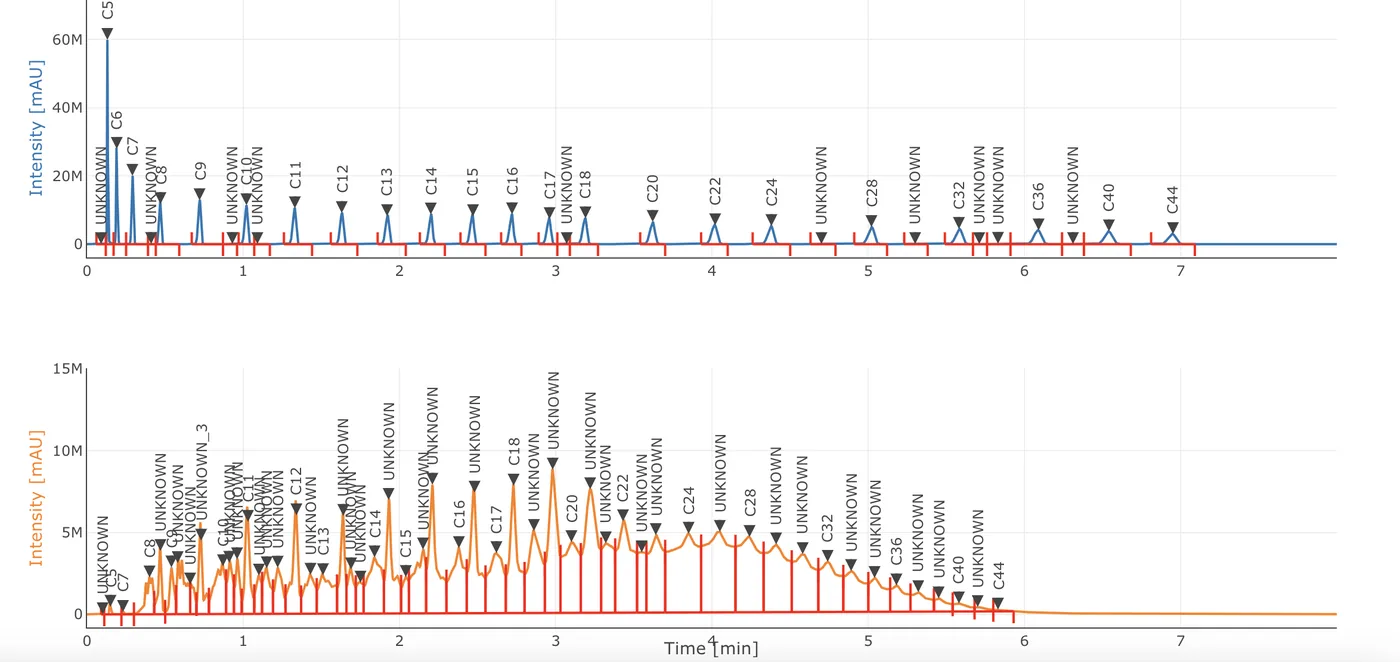
Two gas chromatography runs, split onto shared axes. Every peak is labeled and aligned, so a shifted retention time or a missing compound is obvious in seconds.
Gas Chromatography / Scion GC Analyzer
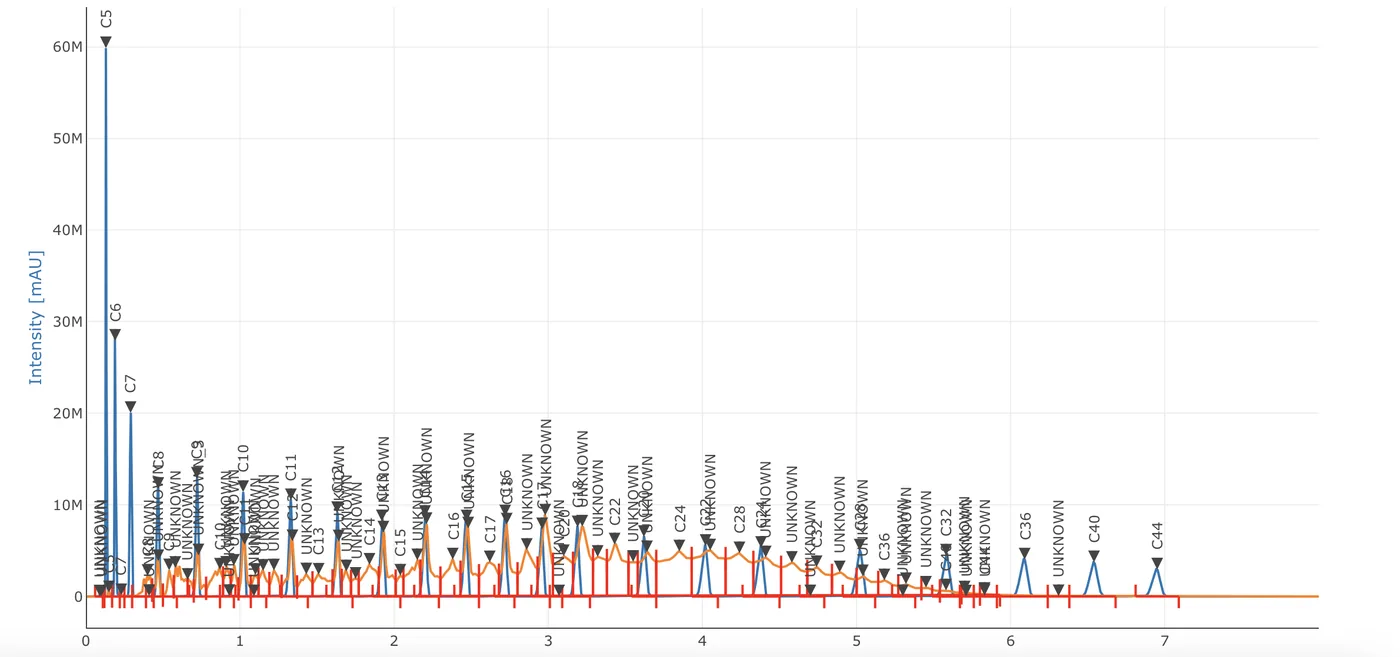
The same two runs, overlaid on one plot. Compare within a technique or across techniques from different vendors, without exporting or reformatting a single file.
Gas Chromatography / Scion GC Analyzer
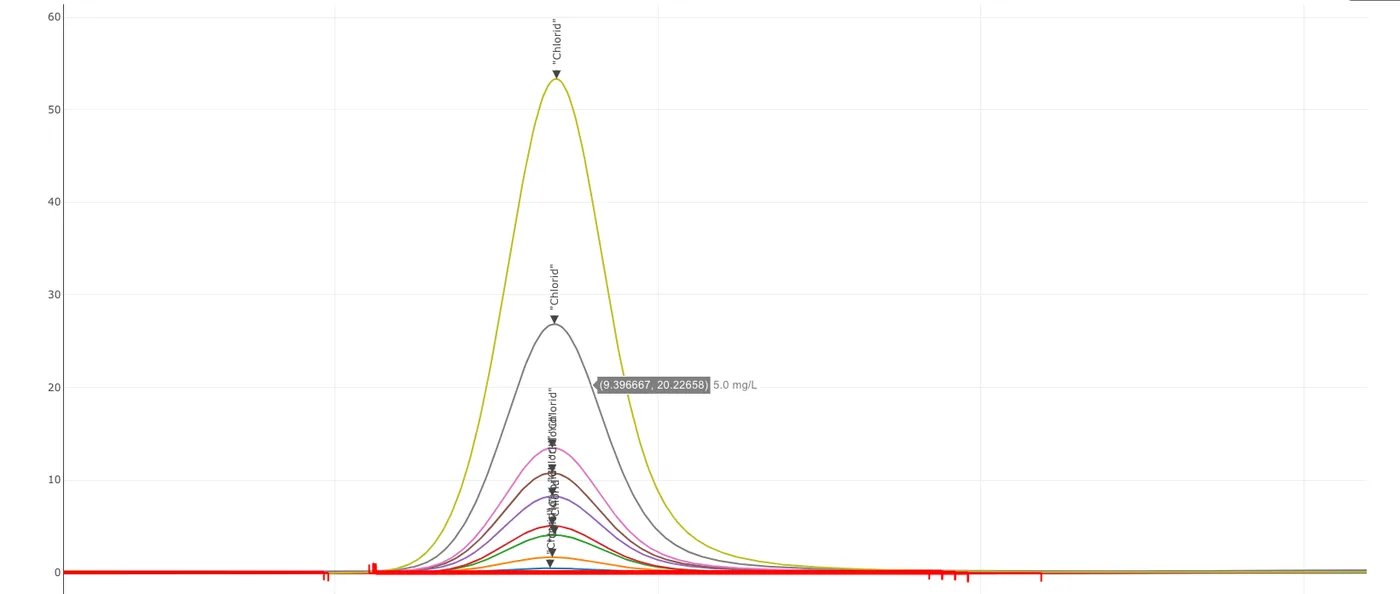
An anion standard series across nine concentrations. Zoom into a single peak and the full-resolution data is still there, every trace and every label.
Ion Chromatography / Thermo Fisher Dionex IC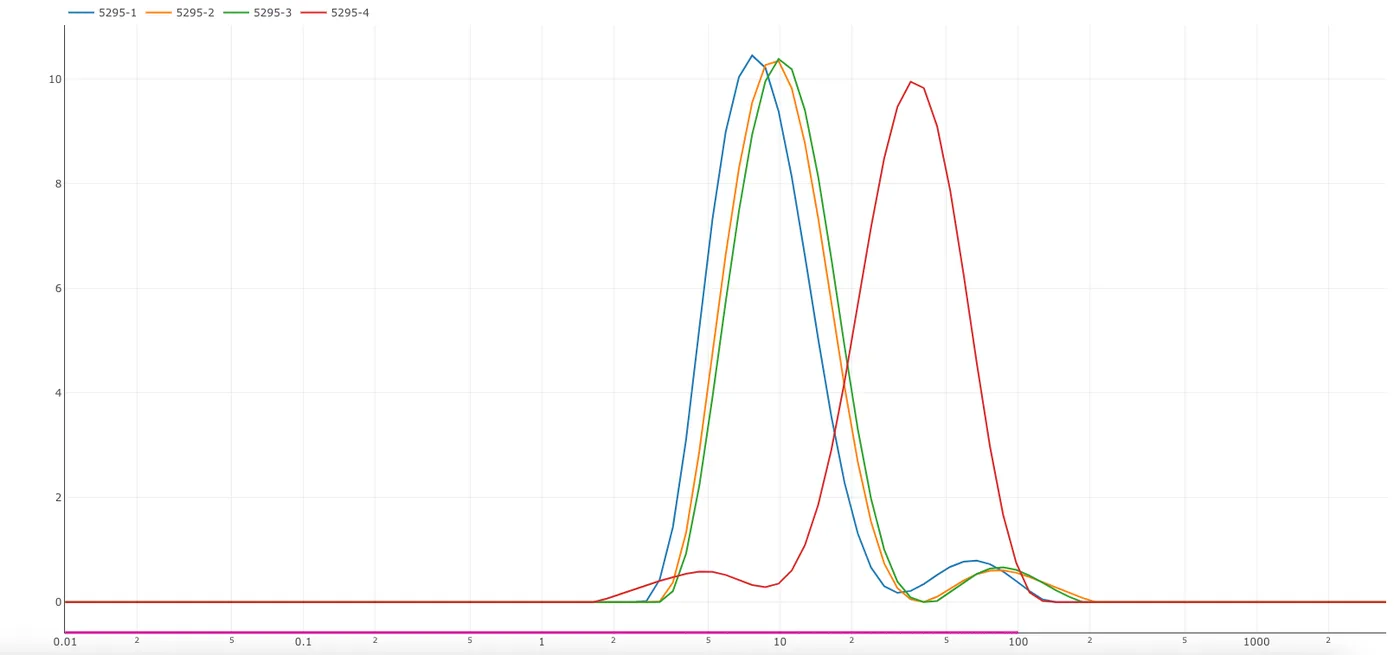
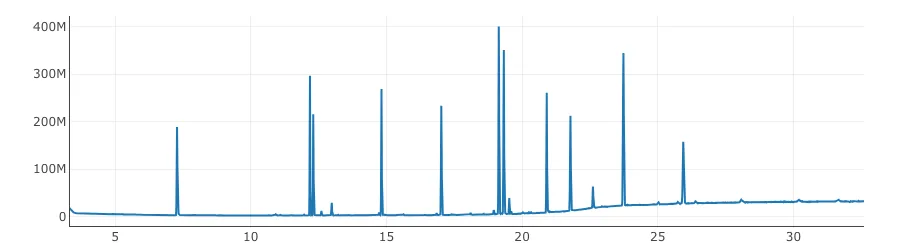
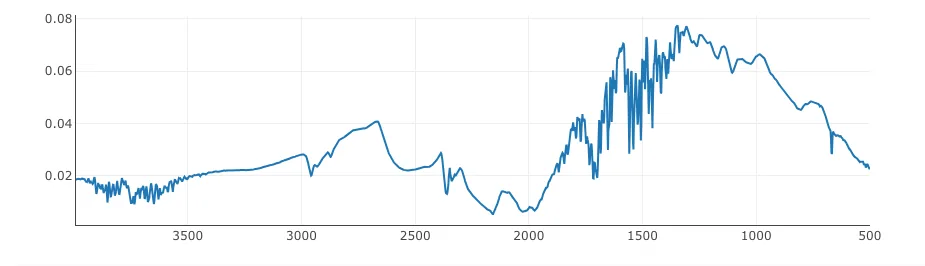
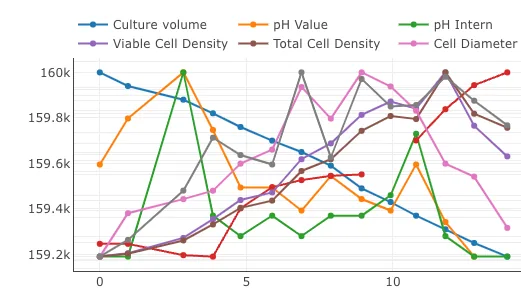

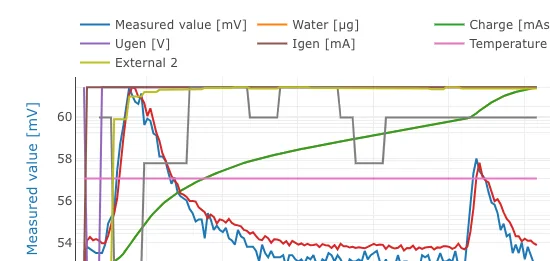
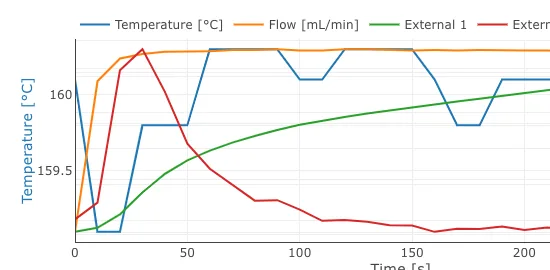
The Splashlake data viewer uses established data standards to present data clearly and effectively. Data types from any vendor across various techniques can be displayed, overlaid and compared.
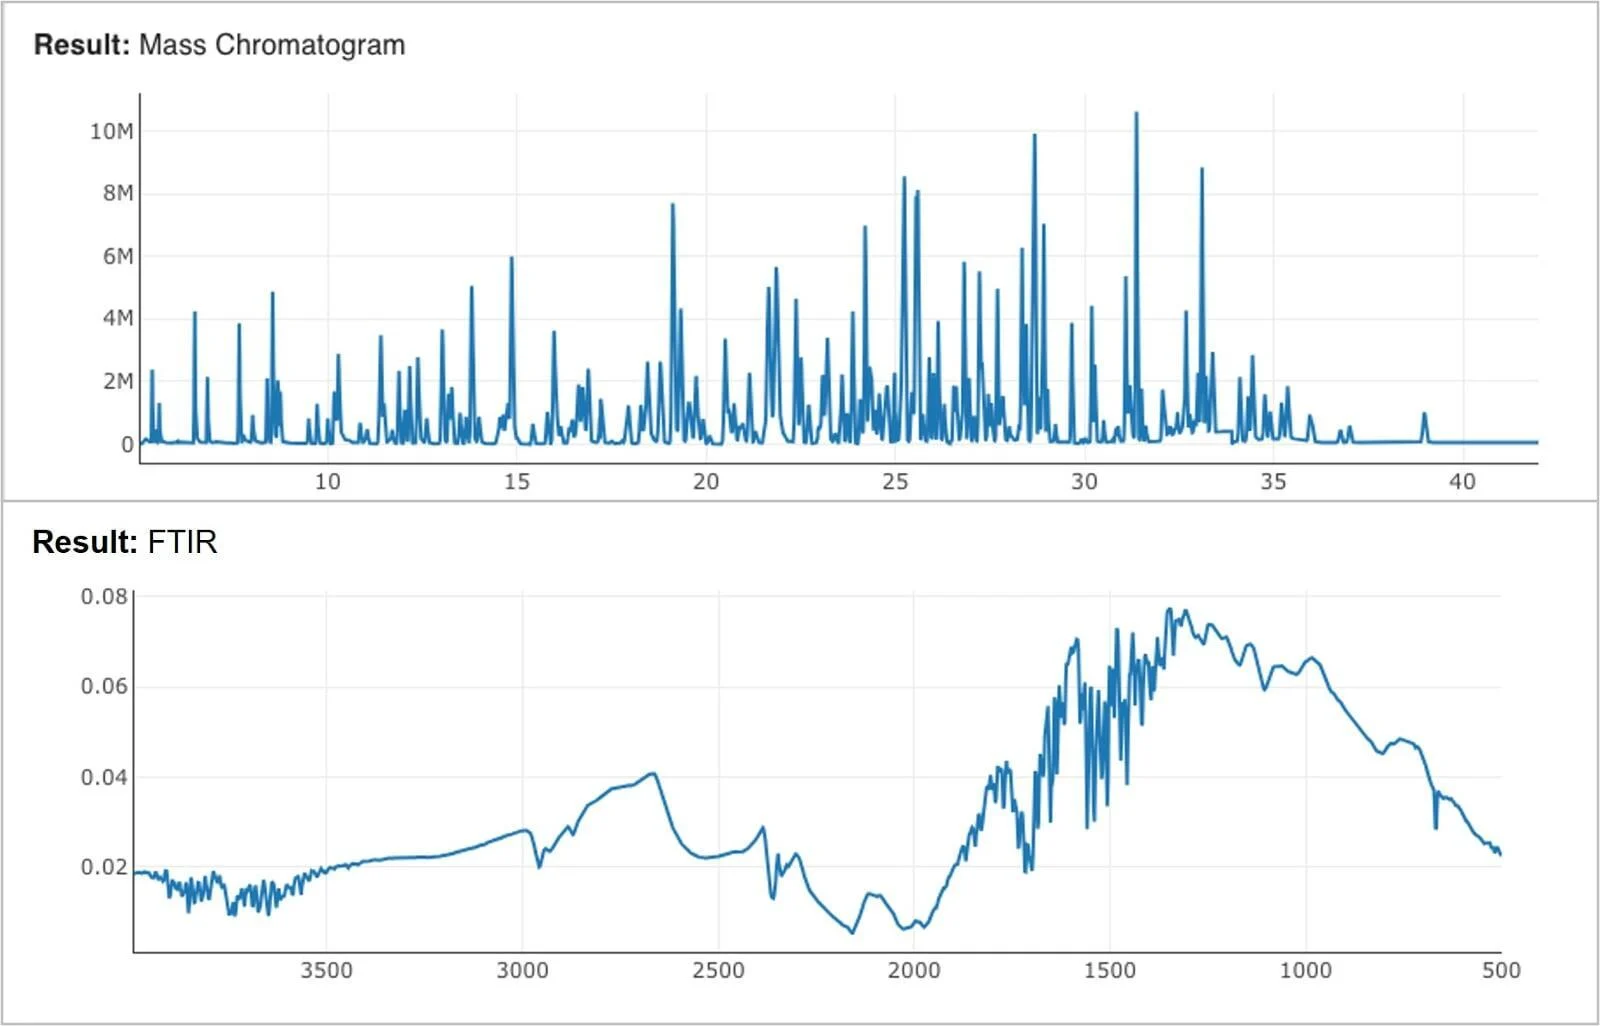
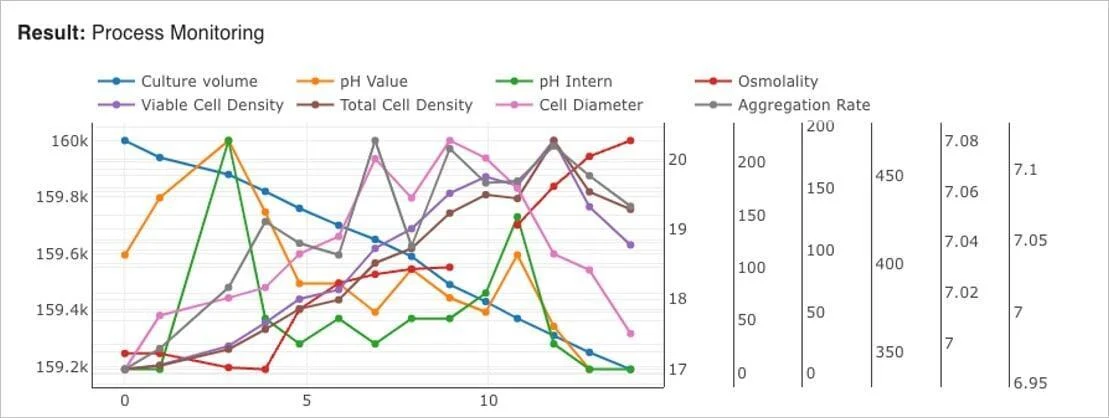
Splashlake provides an innovative scientific data visualization solution that streamlines the process of collecting, integrating, and presenting diverse datasets. Our platform enables users to consolidate data from a wide range of sources and formats, ensuring comprehensive and contextual visualization.

Splashlake effortlessly integrates data from:
Once collected, Splashlake presents data through an intuitive and interactive viewer that empowers users to:
Discover how Splashlake can transform your laboratory and unlock the full potential of your scientific data.
We'll only use your details to respond to your inquiry.